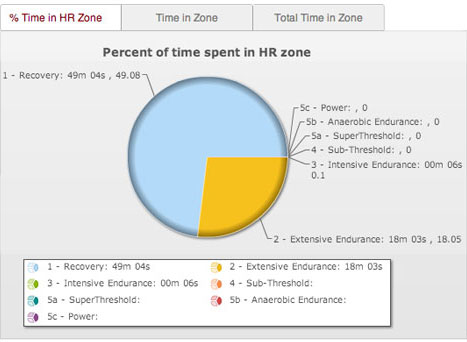

You will have access to three graphs:
These graphs can be generated per workout or on the entire zone for all workouts using it.
Example: I want to see, in total, the zone breakdown of all my workouts together for the last two months.
These graphs can come from several sources: